This HillStudy consists of a series of questions and answers intended to provide a better understanding of economic statistics and federal government finances. It covers such topics as the following:
Each answer defines a concept, illustrates it with a figure or a table featuring the latest related data available for Canada, and provides a historical and sometimes international perspective.
Understanding economic statistics and federal government finances can be complex. Through a series of questions and answers, this HillStudy explores key economic and financial concepts that provide a framework for understanding the federal budgeting process and financial operations.
The most common statistic for measuring a region or country’s production of goods and services is gross domestic product (GDP). For Canada, GDP is available for provinces and territories, industries and even cities. GDP can be compiled based on value added, income (compensation of employees, business profits, etc.) or expenditures (consumption expenditures, government expenditures, etc.).1
Statistics Canada estimated Canada’s GDP for 2024 to be $3,070.024 billion using the income-based method, and $3,068.140 billion using the expenditure-based method. The difference between the two results is called a “statistical discrepancy,” and the official result published by Statistics Canada is the average of the two: $3,069.082 billion.2
GDP per capita is the measure generally used to compare regions or countries with different populations. As the population of Canada was 41.3 million on 1 July 2024, GDP per capita was $74,332. Table 1 shows GDP per capita by province or territory, from highest GDP per capita to lowest, for 2023, as data broken down by region are not yet available for 2024.
| Province or Territory | Population | GDP Level ($ billions) | GDP Per Capita ($) |
|---|---|---|---|
| Northwest Territories | 44,681 | 5.478 | 122,602 |
| Nunavut | 40,700 | 4.825 | 118,550 |
| Alberta | 4,684,514 | 452.410 | 96,576 |
| Yukon | 45,463 | 4.330 | 95,242 |
| Saskatchewan | 1,209,307 | 109.702 | 90,715 |
| British Columbia | 5,531,553 | 409.881 | 74,099 |
| Newfoundland and Labrador | 538,907 | 38.959 | 72,293 |
| Ontario | 15,623,207 | 1,119.545 | 71,659 |
| Quebec | 8,848,020 | 579.460 | 65,490 |
| Manitoba | 1,454,743 | 91.872 | 63,153 |
| Prince Edward Island | 173,713 | 9.924 | 57,129 |
| New Brunswick | 832,190 | 47.035 | 56,520 |
| Nova Scotia | 1,056,486 | 59.574 | 56,389 |
| Outside Canada | – | 0.819 | – |
| Total | 40,083,484 | 2,933.810 | 73,192 |
Note: Activities outside Canada are those that take place in territorial enclaves, such as embassies or military bases located on foreign soil, with the permission of the foreign government concerned. See Statistics Canada, “Chapter 3: Key concepts in brief,” User Guide: Canadian System of Macroeconomic Accounts.
Sources: Table prepared by the Library of Parliament using data obtained from Statistics Canada,
“Table 36-10-0221-01: Gross domestic product, income-based, provincial and territorial, annual (× 1,000,000),” Database, accessed 2 April 2025; and Statistics Canada, “Table 17-10-0009-01: Population estimates, quarterly,” Database, accessed 2 April 2025.
Statistics Canada produces the consumer price index (CPI), which is used to measure the price change of a basket of goods and services typically consumed by the “average Canadian.” The importance accorded to each element in the basket is based on the Survey of Household Spending.3 The basket is reviewed every two years to keep up with new Canadian consumption habits. If the CPI increases, we speak of inflation, and if it decreases, of deflation.
The CPI is often used to adjust (or index) monetary items, including wages and pay rates, government benefits (e.g., Old Age Security benefits) and parameters of the tax system (e.g., the basic personal amount). It is available monthly, by province, territory and major city. Given that it is an index (e.g., equal to 100 everywhere in Canada in 2002), it is not used to compare price levels from region to region, but rather inflation rates. Changes in the price of certain goods and services (e.g., shelter, food) are also available. The Bank of Canada produces other measures of the CPI that exclude its most volatile components.4
The CPI has been calculated in Canada since 1914. A basket of goods and services that cost $1 in 1914 cost $27.25 in 2025.5 Over the years, there have been several significant jumps in the inflation rate of the CPI, particularly in its energy component (see Figure 1). Since 1991, however, the Bank of Canada has targeted a range of 1% to 3% for CPI inflation.6
Figure 1 – Inflation Rate for the Consumer Price Index, Total and Energy Component, Canada, 1968–2024
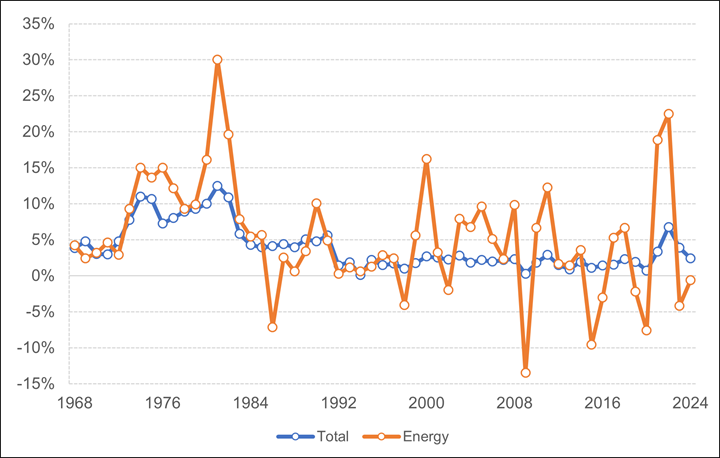
Source: Figure prepared by the Library of Parliament using data obtained from Statistics Canada, “Table 18-10-0005-01: Consumer Price Index, annual average, not seasonally adjusted,” Database, accessed 3 April 2025.
If we want to measure the real increase in the production of goods and services in Canada (i.e., GDP), we must account for their price changes.7 The measure of the price of goods and services is called the “Implicit Price Index (IPP) of the GDP” or, more commonly, the “GDP deflator.”
Nominal GDP is GDP in current dollars, that is, in dollars based on their present value (for a given year or month). Real GDP is equal to the nominal GDP from which the effect of the increase in the price of goods and services produced has been deducted (to determine the real increase in production). To achieve this, the value must be expressed in constant dollars, which means that prices are fixed at the level of a given year.
For example, if nominal GDP was $2,000 billion in current dollars in 2024 and rose to $2,200 billion in current dollars in 2025, nominal GDP increased by 10%. However, if the IPP, as defined above, had a value of 100 in 2024 and a value of 105 in 2025, this means that the price of goods and services produced rose by 5%. If prices are fixed at their 2024 level, real GDP for 2025 will be obtained as follows, in $ billions:
Real GDP therefore increased by 4.76% between 2024 and 2025:
Figure 2 shows that the historical growth of nominal GDP has typically been faster than the growth of real GDP. Nominal GDP has grown faster than real GDP because it includes price changes, which are typically increasing.
Figure 2 – Nominal and Real Gross Domestic Product (GDP), Canada, First Quarter of 1986 to Fourth Quarter of 2024
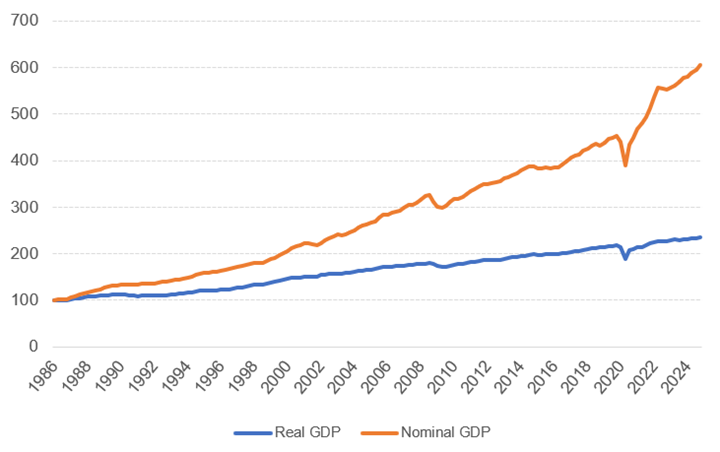
Note: GDP is shown here as an index with a value of 100 for the first quarter of 1986.
Source: Figure prepared by the Library of Parliament using data obtained from Statistics Canada, “Table 36‑10‑0104‑01: Gross domestic product, expenditure-based, Canada, quarterly,” Database, accessed 3 April 2025.
Statistics are often collected on a monthly or quarterly basis. For a variety of reasons, it is observed that statistics as collected (known as “raw data”) seem to systematically post averages that are higher or lower than the annual average in certain months or quarters. For example, retail sales always increase in December due to the holiday season, and employment numbers increase as summer approaches, when students are hired for the season.
Statistical techniques can be used to seasonally adjust a series of data, thereby eliminating the seasonal effect. This makes it possible to compare two consecutive months (in the case of a monthly series) and to observe an increase that is not due to the exceptional nature of the month, for example, December, in the case of retail sales.
Raw data are generally used to compare two months or quarters from different years (e.g., December 2023 and December 2024), while seasonally adjusted data tend to be used to compare different months or quarters of the same year (e.g., November and December 2024).
Figure 3 shows both the raw data and seasonally adjusted data for employment in the trade sector and the health care and social assistance sector between December 2021 and December 2024. The figure shows that there are far more fluctuations in the raw series data for trade employment over the course of a year than in the seasonally adjusted series data, whereas there are significantly fewer differences between the raw and seasonally adjusted data for the health care and social assistance series since employment in that sector is much less seasonal.
Figure 3 also shows flat growth in employment in the trade sector and an upward trend in the health care and social assistance sector.
Figure 3 – Employment, Selected Industries, Raw and Seasonally Adjusted Series Data, Canada, December 2021–December 2024 (millions of persons)
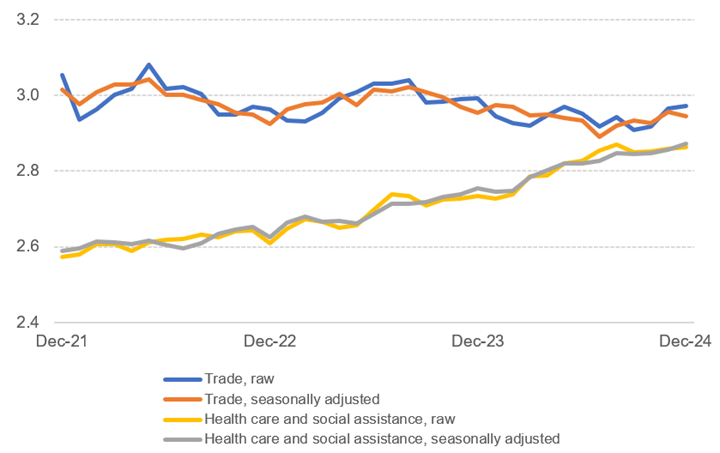
Source: Figure prepared by the Library of Parliament using data obtained from Statistics Canada, “Table 14-10-0355-01: Employment by industry, monthly, seasonally adjusted and unadjusted, and trend-cycle, last 5 months (× 1,000),” Database, accessed 3 April 2025.
In accrual accounting, flows (expenditures or revenues) are recorded when the economic value is created or extinguished. For example, economic value is created when work is performed by an employee. The accrual method can better account for the fact that budget measures often have economic impacts that last more than a fiscal year.
In cash-based accounting, flows are recorded when the economic event is settled, such as through a payment.
For example, suppose a department hires a consultant for two years of work, and the parties agree on an immediate payment of $100,000. Accrual accounting divides that expenditure of $100,000 between the two fiscal years in which the work is performed,8 whereas cash-based accounting records that amount in a single year, at the time of payment. Table 2 illustrates this example.
| Accounting Method | 2023–2024 | 2024–2025 |
|---|---|---|
| Full accrual accounting | $50,000 | $50,000 |
| Cash-based accounting | $100,000 | $0 |
Source : Table prepared by the Library of Parliament based on a fictitious example.
There are also two hybrid systems: modified accrual accounting, which records expenditure and revenue flows when economic value is created or extinguished, other than for the recognition of capital assets, and modified cash accounting, which “allows year-end adjustments to recognizing some non-cash items such as accounts receivable and payable.”9
Beginning with budget 2003,10 the federal government adopted full accrual accounting to replace the modified accrual accounting that had been used since the mid-1980s. The Public Accounts of Canada11 are also published based on full accrual accounting.
However, the main estimates and supplementary estimates – in which the government asks Parliament for spending authority for the various federal organizations – still use modified cash accounting. This is mainly because, unlike the federal budget, which forecasts revenues and expenditures for several fiscal years, the estimates include spending authority for expenditures to be made in the coming year.
The Financial Administration Act (FAA) defines a fiscal year as “the period beginning on April 1 in one year and ending on March 31 in the next year.”12 Various sections of the FAA stipulate that the federal government’s revenues and expenditures must be published in the Public Accounts of Canada for each fiscal year.
This practice has been in place since 1906. Before then, the fiscal year ran from 1 July of one year to 30 June of the next year. Fiscal year 1906–1907 began on 1 July 1906 and ended on 31 March 1907.13
This change was intended to render the fiscal year “more in harmony with the active business season.”14 Moving the end of the fiscal year to 31 March enabled Parliament to adjourn earlier in the summer. This allowed members to return to their ridings, and, when the sitting resumed in November, to have access to complete financial results. Given that the economy was more agricultural at the time, conducting the work of Parliament during a less busy period for business also served to “bring into public life in this country representative men from all parts of Canada.”15 This practice was also in effect in the United Kingdom. Legislation regarding the fiscal year (Bill 162, An Act respecting the Fiscal Year) was adopted in the Senate at third reading on 25 June 1906 and came into effect on 1 July 1906.16
Other statutes nevertheless provide for using the calendar year (1 January to 31 December), essentially for purposes of simplification. This is the case with the Income Tax Act,17 pursuant to which individuals must declare their income for the calendar year, and the Employment Insurance Act,18 under which changes to contribution rates take place as of 1 January.
Some statistics use data for the fiscal year and for the calendar year. By convention, that is the case for the federal debt-to-GDP ratio, which indicates the value of the federal debt in relation to the annual production of goods and services in Canada. Because the results for the fiscal year become available in the summer, when the calendar year is not yet over, the debt-to-GDP ratio for 2024, for example, is determined by dividing the debt for fiscal year 2023–2024 by the 2023 GDP, both of which are already available.
Several measures provide for estimating income distribution, including the “Gini coefficient,” which is one of the most widely used. This coefficient is based on the comparison of cumulative proportions of the population against cumulative proportions of income they receive, and it varies between 0 and 1: a coefficient of 1 represents perfect inequality in income distribution, in that one person has all of the income, while a coefficient of 0 represents perfect equality, in that everyone has exactly the same income. This measure allows for comparing income inequalities across different countries or for comparing inequalities within the same country before and after income redistribution by the state.
In addition to the Gini coefficient, the Organisation for Economic Co-operation and Development (OECD) uses four other indicators to measure income inequality among individuals. The S80/S20 ratio is the ratio of the average income of the 20% richest to the 20% poorest; the D9/D1 interdecile ratio is the ratio of the upper bound value of the ninth decile (i.e., the 10% of people with the highest income) to that of the first decile; the D9/D5 interdecile ratio is the ratio of the upper bound value of the ninth decile to the median income; and the D5/D1 interdecile ratio is the ratio of median income to the upper bound value of the first decile. The Palma ratio is the share of all income received by the 10% of people with highest disposable income divided by the share of all income received by the 40% of people with the lowest disposable income. The measures regarding the D9/D1 interdecile ratio and the income of individuals and families before or after taxes and transfers (which can also be organized in ascending order) are presented in Table 3 for Canada.19
In 2018, the Government of Canada announced that the Market Basket Measure would be used as Canada’s Official Poverty Line. The Market Basket Measure is based on the cost of a basket of goods and services that individuals and families require to meet their basic needs and achieve a modest standard of living.20
Other measures of low income include the Low Income Cut-Offs and the Low Income Measure.21 All three define thresholds below which a family or individual is considered to have a low income. Therefore, the proportion of the population that has a low income can be determined using three different measures, all of which are presented in Table 3, using after-tax income and transfers.
| Year | Income Distributiona | Proportion of the Total Population with Low Income (%) | ||||
|---|---|---|---|---|---|---|
| Gini Coefficient | Income Above the 9th Decile/Income Above the 1st Decileb (%) | Low Income Cut-Offs, After Taxes | Low Income Measure, After Taxes | Canada's Official Poverty Line Market Basket Measure – 2008 Base | ||
| Market Income, Before Taxes and Transfers | Disposable Income, After Taxes and Transfers | |||||
| 2015 | 0.434 | 0.318 | 4.3 | 9.2 | 14.3 | 14.5 |
| 2016 | 0.429 | 0.307 | 4.1 | 8.2 | 13.0 | 12.9 |
| 2017 | 0.437 | 0.310 | 4.1 | 8.0 | 12.6 | 11.9 |
| 2018 | 0.428 | 0.304 | 4.0 | 7.6 | 12.4 | 11.2 |
| 2019 | 0.420 | 0.300 | 4.0 | 6.7 | 12.1 | 10.3 |
| 2020 | 0.438 | 0.280 | 3.5 | 4.3 | 9.3 | 6.4 |
| 2021 | 0.436 | 0.292 | 3.7 | 5.1 | 10.6 | 7.4 |
| 2022 | 0.427 | 0.300 | 3.9 | 6.4 | 11.9 | 9.9 |
Notes:
a. Both the Gini coefficient and the D9/D1 interdecile ratio rely on the Organisation for Economic Co-operation and Development definition of “income” that was introduced in 2012. These data may not be directly comparable with older income distribution data.
b. Disposable income after taxes and transfers is used.
Sources: Table prepared by the Library of Parliament using data obtained from Statistics Canada, “Table 11‑10‑0135‑01: Low income statistics by age, sex and economic family type,” Database, accessed 3 April 2025; and Organisation for Economic Co-operation and Development (OECD), “Income distribution database,” OECD Data Explorer, Database, accessed 3 April 2025.
The federal government accounts can be separated into four main categories: the real accounts of financial statements, the notional accounts of financial statements, the real off-balance-sheet accounts and the fictitious off-balance-sheet accounts.
The federal government’s income (e.g., taxes, income taxes) and expenditures (e.g., personnel, benefits) are managed from the Treasury or “Consolidated Revenue Fund,”22 which is defined as the “aggregate of all public moneys that are on deposit at the credit of the Receiver General.”23
In practice, the federal government has accounts in Canadian financial institutions and the Bank of Canada that enable it to receive and spend money. The aggregate of all these accounts is the Consolidated Revenue Fund. As at 31 March 2024, the Consolidated Revenue Fund totalled $75 billion,24 including $20 billion with respect to the federal government’s Prudential Liquidity Fund, on deposit at the Bank of Canada. This fund exists to enable the federal government to have sufficient liquidity to cover its net projected payments for the following month, in the event of exceptional circumstances that impede the proper functioning of financial markets.
Pursuant to the Currency Act, the Exchange Fund Account is intended to “aid in the control and protection of the external value of the monetary unit of Canada.”25 As at 31 March 2024, it contained the equivalent of $159 billion.26
This type of account does not contain any liquidity and does not refer to “bank accounts” in the traditional sense. These accounts nevertheless have an accounting life that allows users of financial statements to examine the income and expenditures associated with certain programs.
For example, the Employment Insurance Operating Account was created on 1 January 2009. It provides for recording the expenditures and revenues of the program that are credited to this account under the provisions of the Employment Insurance Act.27 The annual deficit or surplus in this account is therefore included in the Public Accounts of Canada.28
Real off-balance-sheet accounts are identical to real accounts of financial statements, except that, as their name indicates, they are not included in the federal government’s financial statements.
The largest real off-balance-sheet account is that of the Canada Pension Plan (CPP). Its revenues and expenditures are also published in the Public Accounts of Canada,29 but the CPP “is excluded from the reporting entity because changes to CPP require the agreement of two thirds of participating provinces and it is therefore not controlled by the [federal] government.”30 Since 2000, CPP benefits have been considerably lower than contributions, which results in the accumulation of significant surpluses to be invested for years when benefits are higher than contributions.31
There is a popular belief that the federal government has a “contingency reserve,” from which it can withdraw money in the event of emergencies (catastrophe, war, etc.). However, there is no such account, except for the previously mentioned $20 billion on deposit at the Bank of Canada that is intended to ensure sufficient liquidity in the event of a collapse of the financial system and that is part of the Consolidated Revenue Fund.
Rather, the contingency reserve is a precautionary measure that is generally included in federal budget forecasts. Since 2009, it has been called the “adjustment for risk.”32 Until the 2021 budget, it was considered when establishing budget forecasts. For example, it was $3 billion in the 2019 budget and was forecasted to remain at $3 billion until 2023–2024.33 Since the 2021 budget, there has been no such provision. Rather, the impact of alternative growth scenarios on public finances has been provided. For example, in the 2024 budget, the downside scenario projecting slower real GDP growth would lead to a deficit equivalent to 1.7% of GDP rather than 1.2% of GDP in 2025–2026.34
The revenues of the federal government include personal and corporate income taxes, excise taxes on certain products, Employment Insurance premiums and the revenues generated by federal departments and Crown corporations, but not Canada Pension Plan premiums.
In 2023–2024, the federal government’s revenues totalled $460 billion, or $11,465 per Canadian.35 They represented 15.5% of GDP, which was $2,965 billion36 (see Figure 4).
Figure 4 – Federal Government Revenues, as a Percentage of Gross Domestic Product (GDP), 2023–2024
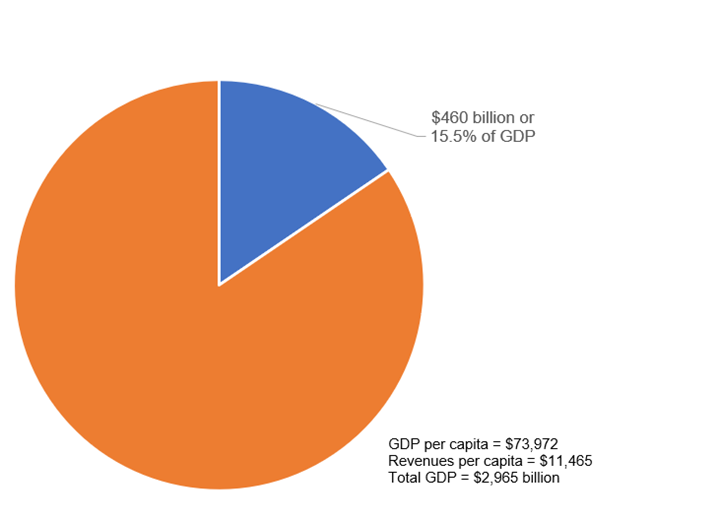
Source: Figure prepared by the Library of Parliament using data obtained from Statistics Canada, “Table 36-10-0104-01: Gross domestic product, expenditure-based, Canada, quarterly,” Database, accessed 4 April 2025; and Statistics Canada, “Table 17-10-0009-01: Population estimates, quarterly,” Database, accessed 4 April 2025. See also Government of Canada, “Section 1: Financial statements discussion and analysis – Ten-year comparative financial information,” Public Accounts of Canada 2024: Volume I – Summary Report and Consolidated Financial Statements.
In 2023–2024, the federal government’s revenues totalled $460 billion. Figure 5 breaks down total revenues by source:
Figure 5 – Federal Government Revenues, by Source, 2023–2024 ($ billions)
![This figure shows the federal government’s revenues for 2023–2024 by primary source (such as income taxes, the Goods and Services Tax [GST], Employment Insurance premiums and other revenues). Personal income tax represented most of the revenues, with a total of $218 billion. Corporate income tax came in at $82 billion, whereas GST revenues amounted to $51 billion. Other revenues accounted for $78 billion, and Employment Insurance premiums were at $30 billion. Total federal revenues for the year were $460 billion.](/staticfiles/PublicWebsite/assets/images/ResearchPublications/HillStudies/2016-23-E_fig5.png)
Source: Figure prepared by the Library of Parliament using data obtained from Government of Canada, “Section 2: Consolidated financial statements of the Government of Canada and report of the Auditor General of Canada – Consolidated financial statements,” Public Accounts of Canada 2024: Volume I – Summary Report and Consolidated Financial Statements.
Between 2015 and 2024, the federal government’s revenues, unadjusted for inflation, rose 64.2%, from $280 billion to $460 billion (see Figure 6). During that same period:
Figure 6 – Increase in Federal Government Revenues, by Principal Source 2015–2024
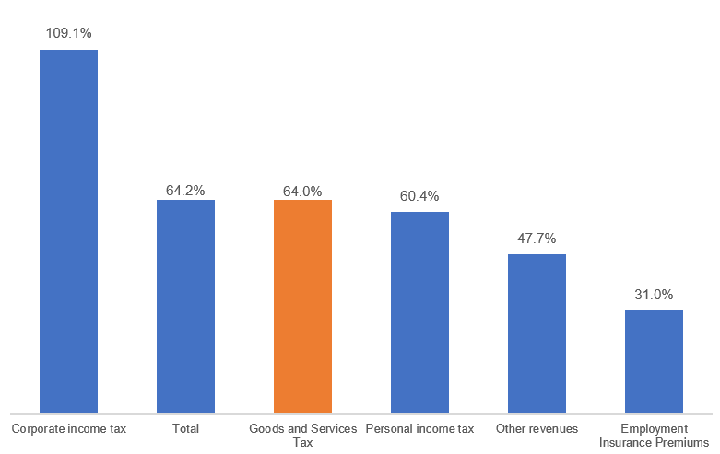
Source: Figure prepared by the Library of Parliament using data obtained from Government of Canada, “Section 1: Financial statements discussion and analysis – Table 1.1: Government of Canada – Consolidated Statement of Operations and Accumulated Operating Deficit – detailed,” Public Accounts of Canada 2024: Volume I – Summary Report and Consolidated Financial Statements.
Introduced in 1917 to finance Canada’s participation in the First World War and originally intended to be a temporary measure,40 personal income tax represented only 3% of federal government revenues in 1918–1919.41 This share held steady at close to 10% until 1939–1940 and then rose to 25% in 1944–1945. In 2023–2024, $218 billion, or 47.4%, of the federal government’s $460 billion in revenues came from personal income tax.
According to the OECD, 51.5% of the Canadian federal government’s revenues came from taxes on the income, profits and capital gains of individuals in 2023, which is higher than the 27.9% average for OECD member countries (see Figure 7).
Figure 7 – Share of Personal Income Taxes in Total National Government Revenues, Selected Countries and Organisation for Economic Co-operation and Development Average, 1973, 1998 and 2023
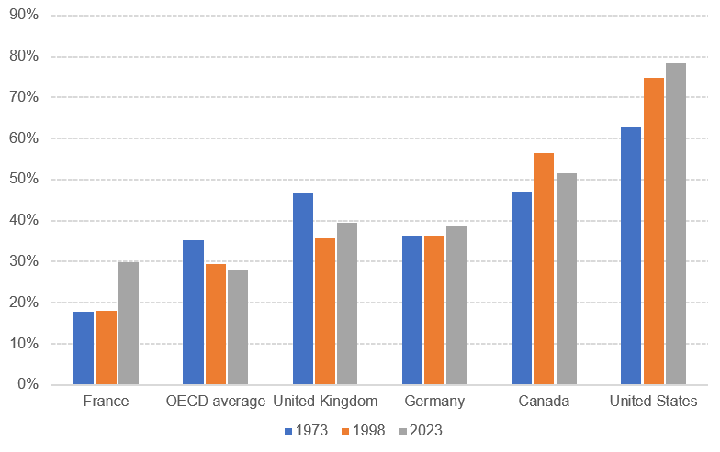
Note: The Organisation for Economic Co-operation and Development average for the reference year 2023 was not available at the time of writing, therefore, the 2023 data presented uses the data for the previous reference year of 2022.
Source: Figure prepared by the Library of Parliament using data obtained from Organisation for Economic Co-operation and Development (OECD), “Comparative tables of Revenue Statistics in OECD member countries,” OECD Data Explorer, Database, accessed 7 April 2025.
The United States federal government also draws a large share of its revenues from personal income tax; it should be noted, however, that there is no general federal sales tax in that country. European countries tend to draw a larger share of their revenues from general taxes on goods and services. For example, in 2023, this figure reached 54.5% in Germany, 37.5% in France and 39.3% in the United Kingdom, compared with 19.3% in Canada and 6.1% in the United States.
Federal government expenditures are varied, and include the following:
In 2023–2024, the federal government’s expenditures totalled $521 billion, or $13,008 per Canadian. They represented 17.6% of Canada’s GDP of $2,965 billion (see Figure 8).
Figure 8 – Federal Government Expenditures, as a Percentage of Gross Domestic Product (GDP), 2023−2024
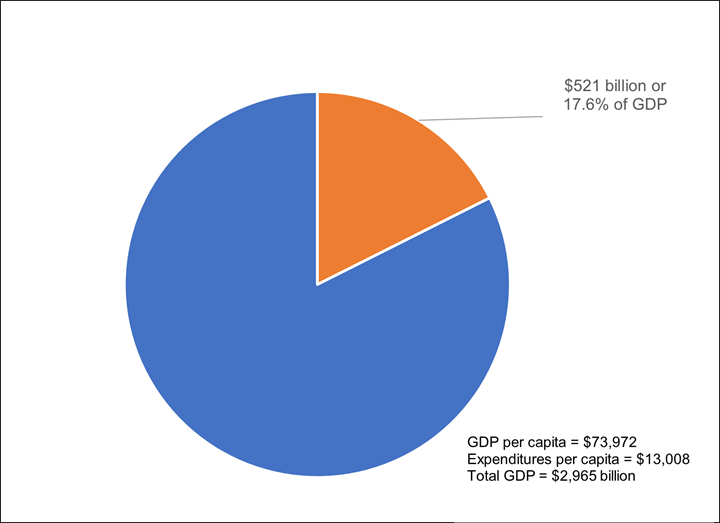
Source: Figure prepared by the Library of Parliament using data obtained from Statistics Canada, “Table 36-10-0104-01: Gross domestic product, expenditure-based, Canada, quarterly,” Database, accessed 7 April 2025; and Statistics Canada, “Table 17-10-0009-01: Population estimates, quarterly,” Database, accessed 7 April 2025. See also Government of Canada, “Section 1: Financial statements discussion and analysis – Financial statements discussion and analysis,” Public Accounts of Canada 2024: Volume I – Summary Report and Consolidated Financial Statements.
In 2023–2024, federal government expenditures totalled $521 billion (see Figure 9). The primary categories of expenditure were the following:
Figure 9 – Federal Expenditures, by Category, 2023–2024 ($ billions)
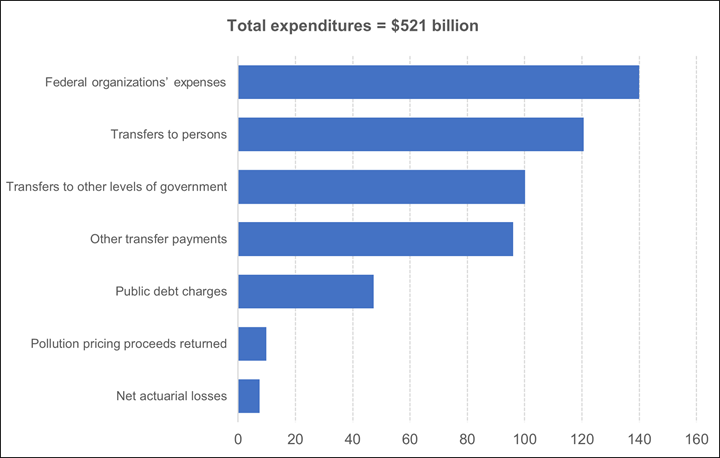
Source: Figure prepared by the Library of Parliament using data obtained from Government of Canada, “Section 2: Consolidated financial statements of the Government of Canada and report of the Auditor General of Canada – Consolidated financial statements,” Public Accounts of Canada 2024: Volume I – Summary Report and Consolidated Financial Statements.
Between 2015 and 2024, federal government expenditures, unadjusted for inflation, rose from $280 billion to $521 billion (+85.9%) (see Figure 10).
Figure 10 – Change in Primary Categories of Federal Government Expenditure, 2015–2024
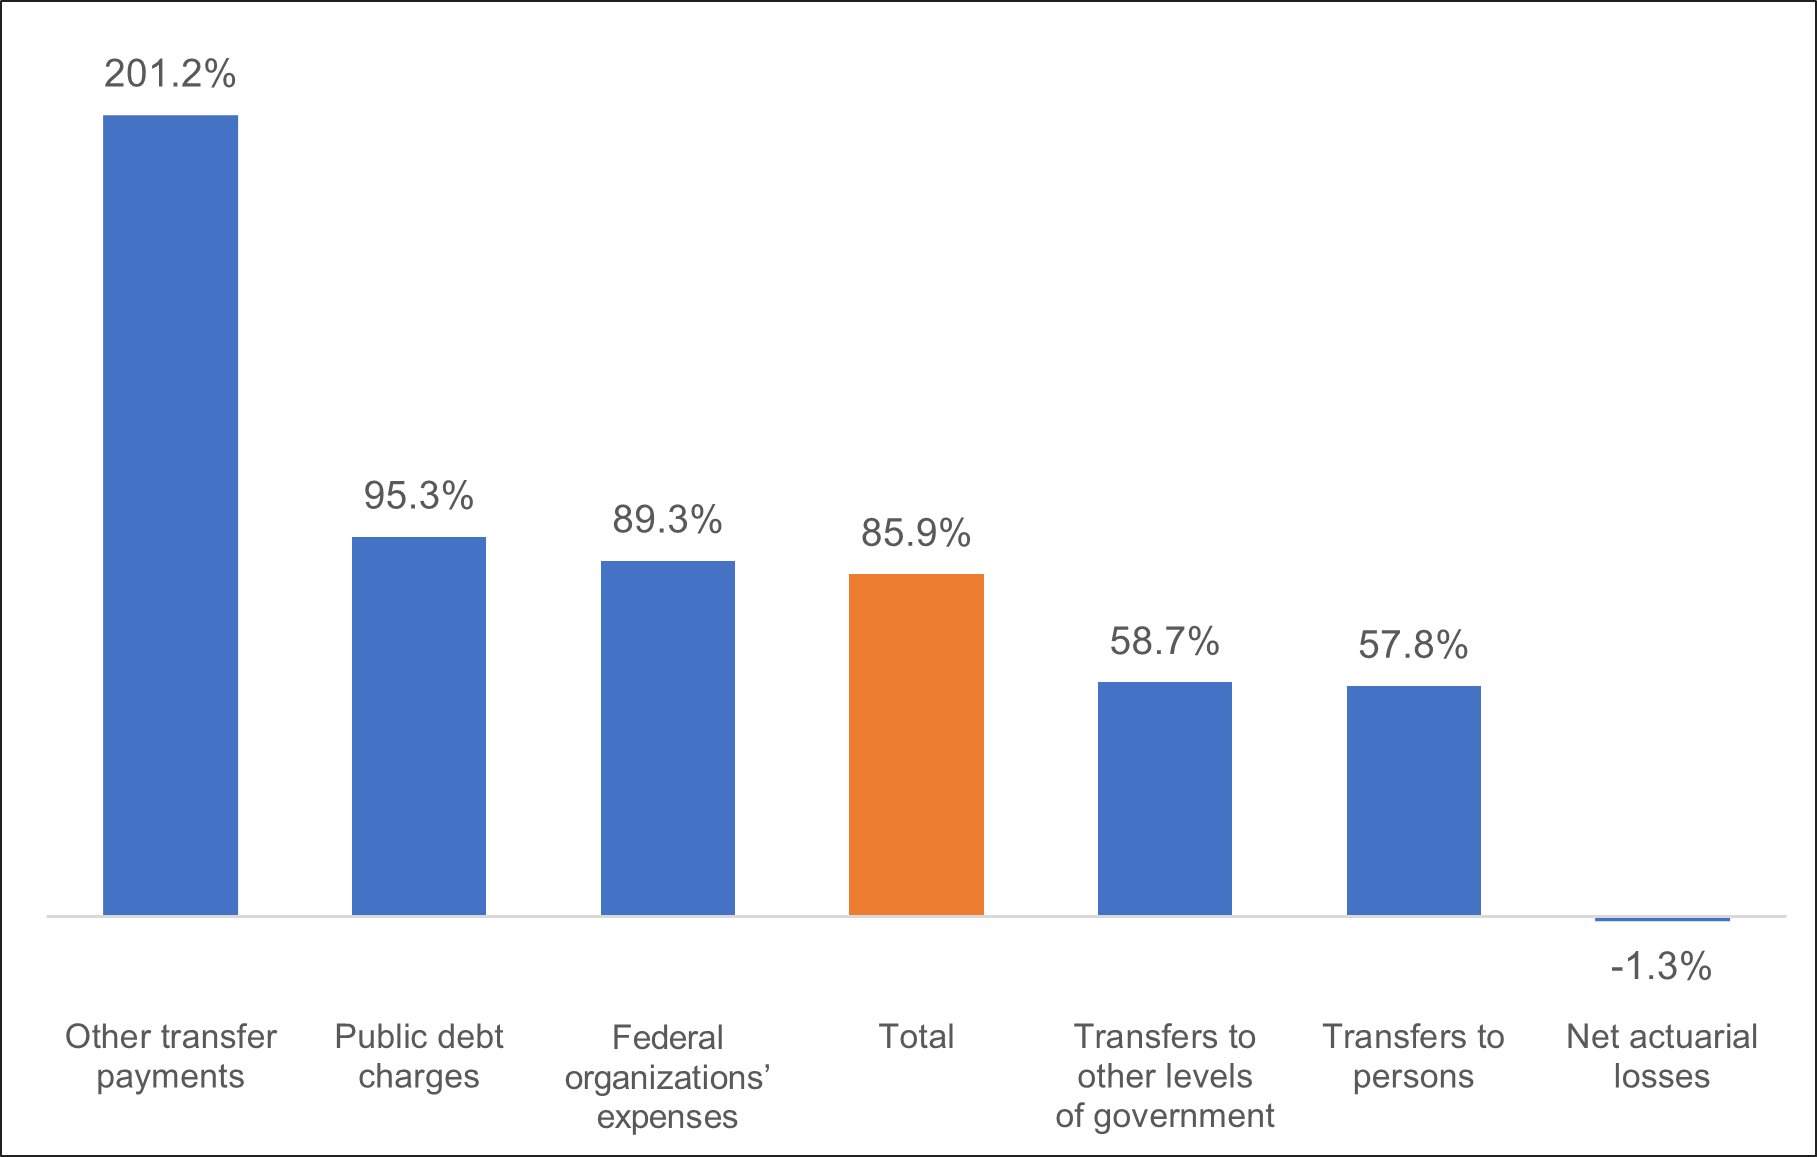
Source: Figure prepared by the Library of Parliament using data obtained from Government of Canada, “Section 1: Financial statements discussion and analysis – Table 1.1: Government of Canada – Consolidated Statement of Operations and Accumulated Operating Deficit – detailed,” Public Accounts of Canada 2024: Volume I – Summary Report and Consolidated Financial Statements.
Table 4 presents data on the size of the federal public service workforce, which includes the core public administration – the employees of the federal departments and agencies listed in schedules I and IV of the Financial Administration Act – and the separate agencies listed in Schedule V of that Act.44
| Type of Agency | 2018 | 2019 | 2020 | 2021 | 2022 | 2023 | 2024 |
|---|---|---|---|---|---|---|---|
| Core public administration | 208,312 | 220,315 | 231,176 | 245,739 | 254,309 | 270,798 | 282,152 |
| Separate agencies | 65,259 | 67,668 | 69,274 | 73,862 | 81,648 | 86,449 | 85,620 |
| Total | 273,571 | 287,983 | 300,450 | 319,601 | 335,957 | 357,247 | 367,772 |
Note: The total includes all active employees (permanent, temporary, casual, students working full- and part-time, federal judges and deputy ministers), but does not include employees on leave without pay, employees hired locally outside Canada, regular members of the Royal Canadian Mounted Police (RCMP) or Canadian Armed Forces, or employees of certain agencies not covered by the Regional Pay System (including employees of the Canadian Security Intelligence Service and the National Capital Commission). As of 31 March 2024, the workforce of the RCMP was composed of 31,820 full-time equivalents (see RCMP, “Human resources,” Departmental Results Report 2023–2024). Employees of Crown corporations are not included in Table 4. Their numbers and financial data are available through Government of Canada, Crown Corporations Financial Data.
Source: Table prepared by the Library of Parliament using data obtained from Treasury Board of Canada Secretariat, “Population of the federal public service by department or agency,” Database, accessed 9 April 2025.
Table 5 shows federal government expenditures on personnel in current dollars. These expenditures include those for employees of the Senate, the House of Commons, the Library of Parliament and the Royal Canadian Mounted Police, and they comprise employee salaries, insurance and benefits.
| Expenditures on Personnel | 2019–2020 | 2020–2021 | 2021–2022 | 2022–2023 | 2023–2024 |
|---|---|---|---|---|---|
| Amount | 46.3 | 53.0 | 60.7 | 56.5 | 65.3 |
Source: Table prepared by the Library of Parliament using data obtained from Government of Canada, “Personnel Expenditures (2019–20 to 2023–24),” GC InfoBase, Database, accessed 9 April 2025.
If all the federal government’s expenditures are subtracted from its revenues for a given fiscal year, the result is the annual budgetary balance. There is a surplus when the balance is positive and a deficit when it is negative.
A new concept, the budgetary balance before net actuarial losses, was introduced in the Public Accounts of Canada 2020. Net actuarial losses come from the annual reassessment of the government’s existing obligations for pensions and other future benefits owed to veterans and government employees:
While these adjustments and revaluations are an important part of providing an accurate picture of the government’s Consolidated Statement of Financial Position at any given time, they can also result in large swings in the budgetary balance, which may impair the usefulness and understandability of the government’s consolidated financial statements and fiscal projections, including as a measurement of the short-term impact of government spending and taxation choices on the economy.45
Another concept that is often used is the primary or operating balance. Instead of excluding net actuarial losses from total expenditures, the primary balance excludes public debt charges (interest payments on the debt).
In 2023–2024, net actuarial losses were $7.5 billion, down from $9.6 billion in 2022–2023, and public debt charges represented $47.3 billion, up from $35 billion in 2022–2023. Hence, the budgetary deficit was $61.9 billion (up from $35.2 billion in 2022–2023), the deficit before net actuarial losses was $54.4 billion (up from $25.7 billion in 2022–2023), while the primary deficit totalled $14.6 billion (from a deficit of $367 million in 2022–2023).46
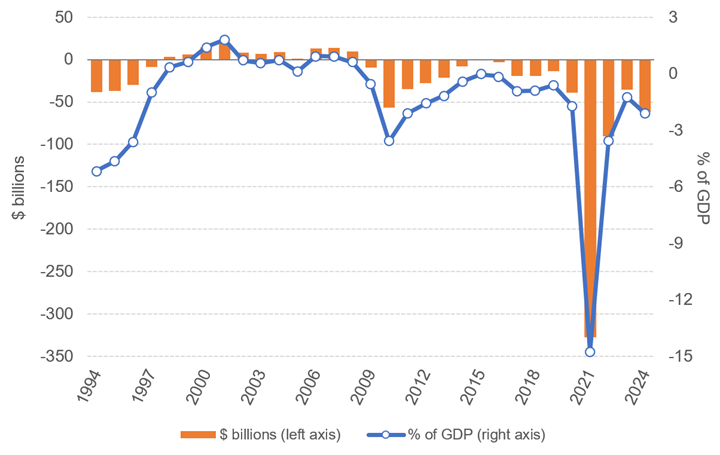
Figure 11 depicts the annual budgetary balance of the federal government from 31 March 1994 to 31 March 2024. The balance is also shown as a percentage of GDP from the previous calendar year.47
Figure 11 – Annual Budgetary Balance of the Federal Government, 1993–1994 to 2023–2024 ($ billions and % of Gross Domestic Product [GDP])
Source: Figure prepared by the Library of Parliament using data obtained from Government of Canada, “Table 1: Fiscal transactions,” Fiscal Reference Tables December 2024; and Statistics Canada, “Table 36-10-0104-01: Gross domestic product, expenditure-based, Canada, quarterly,” Database, accessed 9 April 2025.
Budgetary balances are influenced by the health of the economy. For example, after the recession of 2008–2009 and in 2020 during the COVID-19 pandemic, government revenues decreased and expenditures increased, generating significant annual deficits that affected balances for subsequent years.
A budgetary surplus has an impact on the federal government’s financial resources (and a budgetary deficit, on its financial requirements), which are also affected by changes in non-budgetary transactions (loans, foreign exchange activities) and cash balances. Cash balances are composed of liquidity held by the federal government at the Bank of Canada and financial institutions. They are primarily determined by actual requirements for the current year.
In 2023–2024, there was a budgetary deficit of $61.9 billion. However, non-budgetary transactions generated financial requirements of $23.9 billion, resulting in a net change in financing requirements of $85.7 billion.48 The federal government also increased its cash balances by $26.1 billion, from $49 billion in 2022–2023 to $75.1 billion in 2023–2024. The $111.8 billion associated with these financial requirements was financed through an increase in unmatured debt (to be repaid later).
Where did this increase in unmatured debt come from? The government increased its debt in marketable bonds (Canadian currency) by $42.7 billion and its debt in Treasury bills by $64.1 billion. The government decreased its retail debt by $0.7 billion. These transactions, among others, led to an increase in unmatured debt of $111.8 billion.
The gross debt is the total of liabilities and interest-bearing debt resulting from past deficits that had to be financed through loans, as well as debts associated with pension plans. It is called “gross” because it does not consider the financial assets held by the federal government.
Net debt is obtained by subtracting financial assets from the gross debt.
Finally, the government’s non-financial assets, such as the buildings and infrastructure it owns, can be deducted from the net debt to obtain the accumulated deficit, which is also known as the “federal debt.”49
As at 31 March 2024, the gross federal debt – or total liabilities – totalled $2,058 billion. When $705 billion in financial assets are deducted, the net debt is $1,353 billion. If non-financial assets of $117 billion are further deducted, the accumulated deficit – the federal debt – is $1,236 billion.50
Figure 12 shows changes in the gross federal debt and the accumulated deficit – the federal debt – from 1983–1984 to 2023–2024. The difference between the two is equal to the sum of financial and non-financial assets.
Figure 12 – Gross Federal Debt, 1983–1984 to 2023–2024 ($ billions)
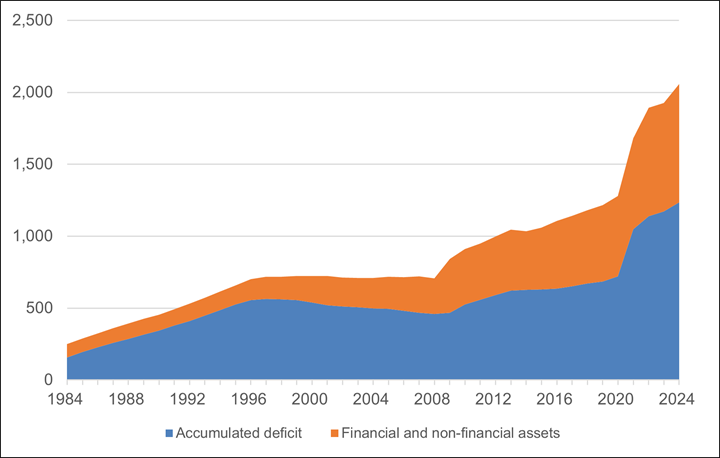
Note: The accumulated deficit is obtained by subtracting financial and non-financial assets from gross federal debt.
Source: Figure prepared by the Library of Parliament using data obtained from Government of Canada, “Table 15: Total liabilities, net debt and the accumulated deficit,” Fiscal Reference Tables December 2024.
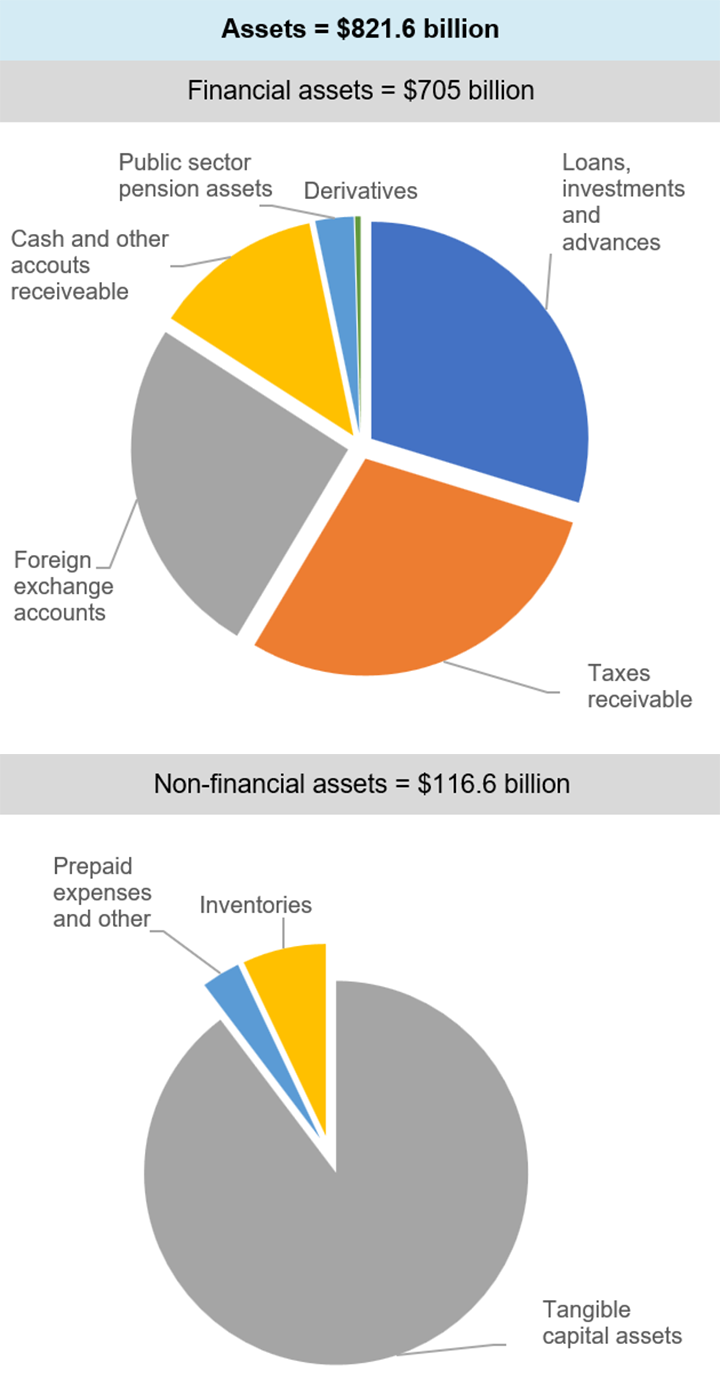
The federal government’s assets totalled $821.6 billion as at 31 March 2024. They can be broken down into two main categories:
Financial assets consist of money in the government’s possession (e.g., cash) or money that is receivable (e.g., taxes receivable or loans granted). Loans, investments, advances and taxes receivable represent almost two-thirds of these assets.
Non-financial assets include tangible goods, such as buildings and land.
Figure 13 shows the breakdown of federal government assets by category.
Figure 13 – Federal Government Assets, by Category, as at 31 March 2024
Source: Figure prepared by the Library of Parliament using data obtained from Government of Canada, “Table 8: Outstanding Debt at Year-End,” Annual Financial Report of the Government of Canada: Fiscal Year 2023–2024.
Compared with 2022–2023, financial and non-financial assets increased by $62.7 billion and $6.9 billion, respectively.
Between 2022–2023 and 2023–2024, the federal government’s gross debt – or liabilities – rose from $1,925 billion to $2,058 billion. In 2023–2024, this debt could be broken down as follows:
Most of the interest-bearing debt was unmatured debt ($1,377 billion) such as marketable bonds ($1,102 billion) and Treasury bills ($267 billion). The rest of the interest-bearing debt ($369 billion) included future benefits of public service employees (notably $165 billion in pension benefits) and other types of liability.52
Figure 14 shows changes between 1985–1986 and 2023–2024 in the value and share of unmatured debt held by non-residents. These amounted to $437 billion in 2023–2024, or 31.8% of the total value of unmatured debt.
Figure 14 – Value and Share of Unmatured Debt Held by Non-residents, 1985–1986 to 2023–2024

Source: Figure prepared by the Library of Parliament using data obtained from Government of Canada, “Table 14: Interest-bearing debt,” Fiscal Reference Tables December 2024.
A country’s debt is often divided by its annual GDP to gain an idea of its ability to repay this debt. If the GDP increases faster than the debt, the debt-to-GDP ratio decreases, which means that the capacity to repay the debt increases.
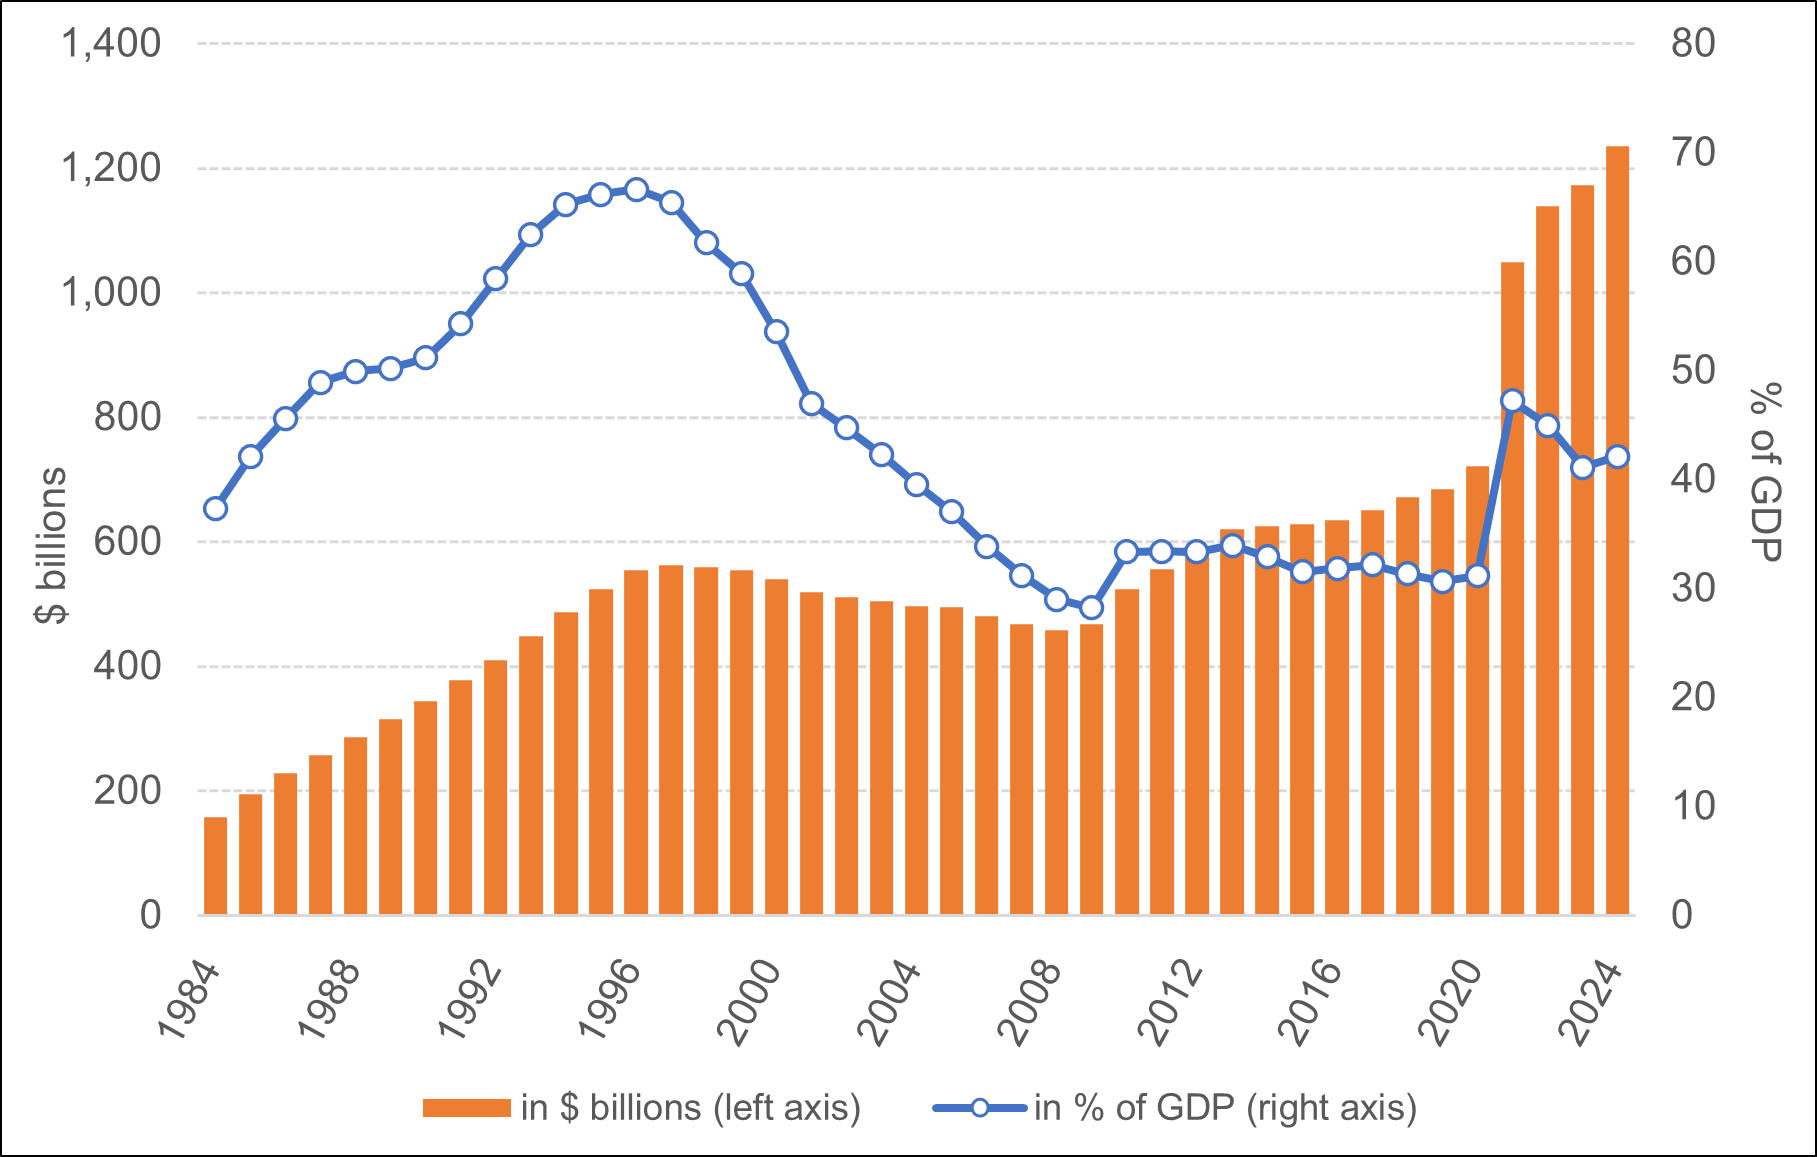
Figure 15 presents changes in Canada’s federal debt (accumulated deficit) and debt-to-GDP ratio between 1983–1984 and 2023–2024.
Figure 15 – Federal Debt, 1983–1984 to 2023–2024 ($ billions and % of Gross Domestic Product [GDP])
Source: Figure prepared by the Library of Parliament using data obtained from Government of Canada, “Table 15: Total liabilities, net debt and the accumulated deficit,” Fiscal Reference Tables December 2024; and Statistics Canada, “Table 36-10-0104-01: Gross domestic product, expenditure-based, Canada, quarterly,” Database, accessed 9 April 2025.
The federal debt increased until 1997, when it reached $563 billion. One year earlier, the debt-to-GDP ratio had peaked at 67%. The debt then decreased until 2008, when it totalled $458 billion, with a debt-to-GDP ratio at 28% in 2009. After the recession of 2008–2009 and the COVID-19 pandemic in 2020, the debt increased until it reached $1,236 billion as at 31 March 2024. The debt-to-GDP ratio reached 47% in 2021, and then declined to 42% as at 31 March 2024.
It can sometimes be difficult to make comparisons among countries as some central governments may play a greater role in certain areas (spending on health care, education, etc.) than local governments, thereby generating a higher percentage of spending by central governments than local governments.
Public debt (all governments combined) can nevertheless be compared relative to GDP. The reality is that few countries can boast of having repaid their debt. According to data from the International Monetary Fund, in 2023, only a few countries, such as Luxembourg and Norway, had positive gross debt and negative net debt (gross debt less financial assets).
In 2023, for example, the government’s net debt-to-GDP ratio was -110% in Norway, 13% in Canada, 96% in the United States and 154% in Japan (see Table 6).
| Country | Gross Debt (% of GDP) | Net Debt (% of GDP) |
|---|---|---|
| Norway | 44 | -110 |
| Canada | 107 | 13 |
| Finland | 77 | 35 |
| Germany | 63 | 45 |
| United Kingdom | 100 | 91 |
| United States | 119 | 96 |
| France | 110 | 102 |
| Italy | 135 | 124 |
| Japan | 250 | 154 |
| Greece | 169 | n/a |
Source:Table prepared by the Library of Parliament using data obtained from International Monetary Fund, “World Economic Outlook Database,” accessed 10 April 2025.
 (402 KB, 55 pages), Sixth report, December 2006, p. 4. [ Return to text ] (1.05 MB, 382 pages), pp. 277–298. [ Return to text ] (5.14 MB, 430 pages), Budget 2024, p. 361. [ Return to text ]
On 25 July 1917, the Minister of Finance, the Honourable Sir Thomas White, told the House of Commons:
Therefore I have placed no time limit upon this measure, but merely have placed upon Hansard the suggestion that, a year or two after the war is over, the measure should be deliberately reviewed by the Minister of Finance and the Government of the day, with the view of judging whether it is suitable to the conditions which then prevail.
See Library of Parliament, “House of Commons Debates, 12th Parliament, 7th Session: Vol. 4,” Canadian Parliamentary Historical Resources, Database, 25 July 1917, p. 3765.
[ Return to text ]© Library of Parliament