The Census Data by Region interactive map allows users to access and view socio-economic data from Statistics Canada’s 2021 Census of Population based on provinces and territories, federal electoral districts and dissemination areas.
The map is optimized for use on desktop and laptop computers. Display constraints associated with screen size diminish the user experience on devices such as tablets and smart phones.
The map provides visual representations of selected socio-economic variables for three geographic levels:
The variables are divided into four main themes:
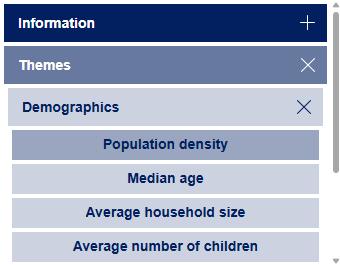
Select a theme and a socio-economic variable from the dropdown menu under Themes.
Figure 1. Selecting a theme and socio-economic variable
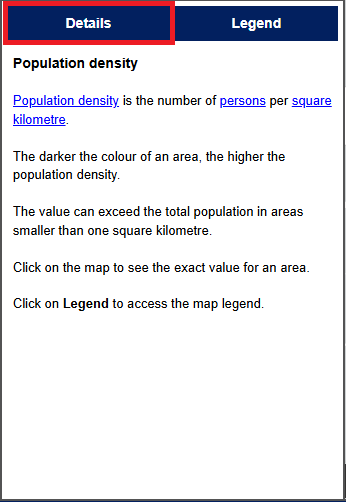
A description of the selected variable will appear in the Details window.
Figure 2. Details window with description of selected variable
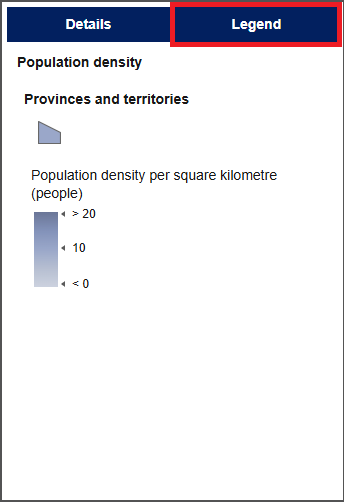
Click on Legend to view the map legend.
Figure 3. Map legend on the Legend screen
When viewing the map, click on the plus sign to zoom in or on the minus sign to zoom out. You can also zoom in and out using your mouse scroll wheel. Click on the Default Map View tool (house symbol) to return to the original view.
Figure 4. Zoom feature

The default map view displays provinces and territories. As you zoom in, federal electoral districts and dissemination areas appear. The legend changes to reflect the new geography level.
Press and hold the left button of your mouse to pan around the map.
For a clearer view of the basemap, click on the No layer icon in the bottom left corner of the map. This will remove the census information from the map. To add it back, click on the icon again.
Figure 5. Map

Use the search bar to find a specific federal electoral district, address or a place. Click on the desired name or address to select it. Click on the X in the search bar to clear the selection.
Figure 6. Finding a location by use of the search bar
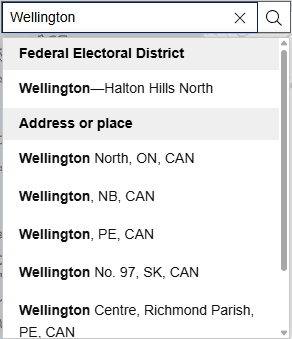
When searching for a federal electoral district, make sure to use the exact spelling of the official name, as provided here.
Click on the map to make a selection and display the pop-up window with additional information. Click on the arrows at the bottom of the window (highlighted in red below) to view multiple selections. For example, if you select a dissemination area and click the right arrow, you will see the name of the electoral district in which it is. Click on the X to close the window and clear the selection.
Figure 7. Location selection
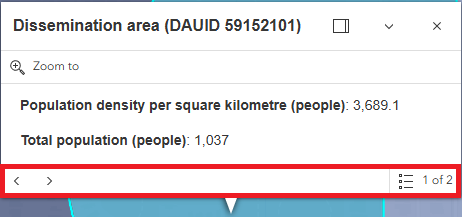
The Zoom to functionality within a pop-up window allows you to navigate directly to a selected feature. Note: You may not be able to zoom to the full extent of an area if it is too large.
If you are looking for additional Census information for a province, territory or federal electoral district, enter its name in the search bar of the Census Profile. For dissemination areas, enter the dissemination area unique identifier (DAUID) number provided in the map pop-up window (highlighted in red below).
Figure 8. Using the dissemination area unique identifier (DAUID) for additional census information

Take a screenshot of the map to print it. For Windows, use the snipping tool (Windows logo key + Shift + S). On a Mac, press Shift + Command + 4.
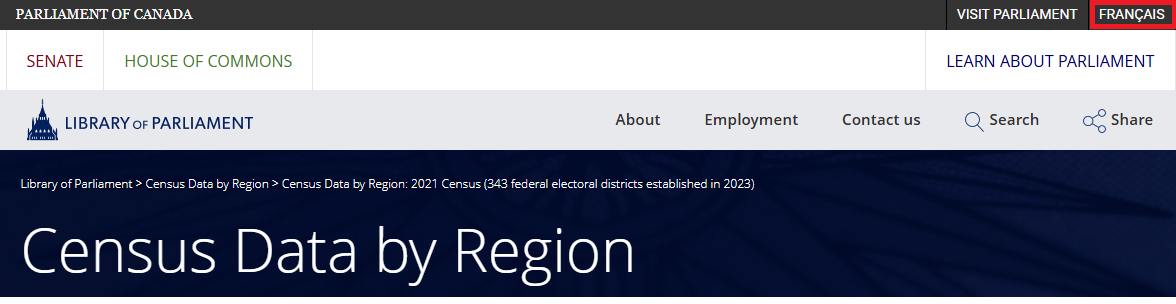
To access the French version, click on this link or the FRANÇAIS link in the top right corner of the page (highlighted in red below).
Figure 9. Changing page language
The interactive map allows users to visualize a very large volume of data. Loading times and overall responsiveness may vary depending on several factors, including Internet connection quality, network latency, server capacity, as well as the hardware and software characteristics of the device and browser being used.
You can do a few things to optimize map performance:
To protect confidentiality, Statistics Canada uses a process called random rounding, in which numbers are randomly rounded up or down to the nearest multiple of 5 or 10. This method helps prevent individuals from being identified in the data. Since population counts are not rounded, some values may not add up to the exact total or population count. Counts are sometimes per person at the dissemination area level since percentages would not add up to 100%.
To further protect confidentiality, Statistics Canada also uses a technique called area suppression. This means that information is not published for geographic areas where the population size is below a certain threshold. These areas appear in grey on the map.
For more information, please see the Guide to the Census of Population, 2021.
The interactive map presents information from the 2021 Census of Population. Data was obtained from the following sources:
A custom dataset prepared by Statistics Canada for the Library of Parliament is also used for population data by federal electoral district.
The map contains information that is subject to the Statistics Canada Open Licence and the Open Government Licence - Canada.
The map was created using Esri’s ArcGIS Online platform. Esri basemaps are the intellectual property of Esri and are used under licence, © 2025 Esri and its licensors.
The map projection is WGS 1984 Web Mercator (auxiliary sphere).
Any comments or questions should be submitted to the Library of Parliament at info@parl.gc.ca.